
We briefly touched on TV Fool in Part 2 of the series, but in part 3 of our series we'll get to the nitty gritty! I've ran the TV Fool report for a central Charlotte, NC ZIP code 28202. Here was the result:
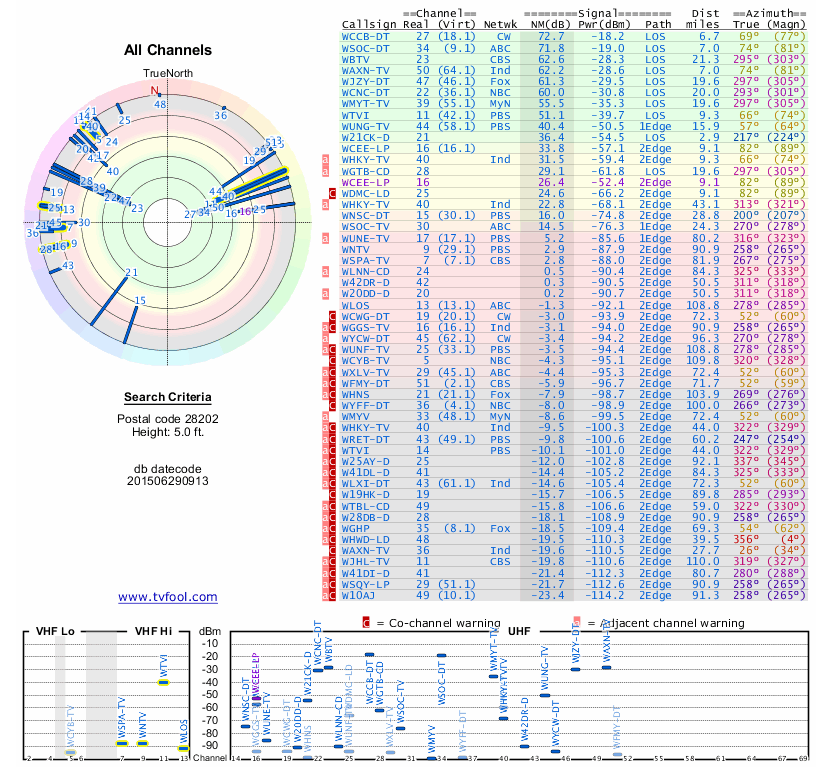
Looking at that might be confusing as heck, but in reality it is fairly straightforward. The circle on the left represents where all of the transmitters are located. If you find it hard to read, its mainly because there are so mainly broadcasts available in the region that they overlap when plotted.
The table on the left shows the call signs, channel numbers, networks, signal strength, distance, and direction of the transmitters/stations in the area. The color coding is probably the single best resource on this table. The stations in green you should be able to easily tune with a quality indoor antenna. Stations in yellow would require an attic mounted antenna. Those in the red would require a roof mounted antenna, and finally those in the gray area are probably going to take very extreme measures to receive at all. The other data piece I want to point out is that column that says "Path." You'll notice that they say either LOS, 1Edge, 2Edge, and there is another outcome that says Tropo (not pictured above). Those terms can get overly technical to explain, but know that LOS>1Edge>2Edge>Tropo in terms of how realistic you can expect to receive those signals.
If this has you encouraged, I'll answer by saying "Great!" It should! However I do need to temper any expectations by saying that those colors are estimates. Good estimates, but they cannot take into account every scenario. For examples of how things might change consider other devices you use currently that are affected by obstacles. Maybe your cell phone has full strength outdoors, but drops a bar or 2 when you go inside. Maybe you currently have satellite and it goes in an our due to heavy weather. Any number of things can affect reception, its just the way the technology works. If you have a large object be it a man made structure or geographic feature between you and the transmitter it will affect your signal.
Even though Charlotte Cord Cutter is based slightly north of Charlotte, we don't experience much in the way of difficulty with many of the stations. There are times when the signal just isn't very good, and that station is un-watchable, but I have yet to experience any persistent difficulty the stations in the green and yellow sections of my own report.
Another great function of TV Fool is the TV Signal Map. This allows you to view a graphical representation of the estimated reception of a given broadcast as well as show you where on the map the transmitter is (WCCB Pictured):

You can focus this map using your address or you can play around and just see what is out there, which might be useful if you're interested in what you might expect if you moved or something to that effect. Even though we focus on examples centered around Charlotte, the information really pertains to the whole country.
The next installment of this series will focus on the actual antenna itself, so in the mean time I would recommend running one of these reports for your situation so you can know what you might be in for when it comes to choosing an antenna. Stay tuned!
No comments:
Post a Comment